Debkalpa Das👋
Innovative and enthusiastic CSE Professional. Proficient in data visualization,
manipulation
and analysis. Skilled in problem solving,
creative thinking, leadership and management.

Innovative and enthusiastic CSE Professional. Proficient in data visualization,
manipulation
and analysis. Skilled in problem solving,
creative thinking, leadership and management.
MS Excel Data Analysis
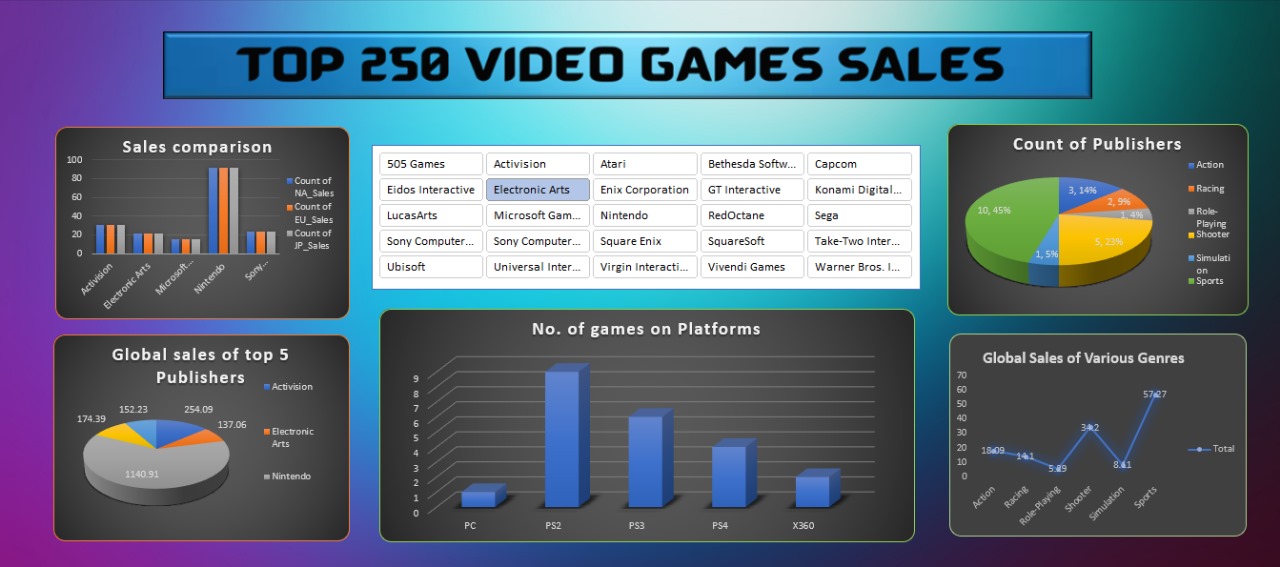
In this project, I have created a dashboard which highlights the various video games sales by different companies throughout the course of our modern history. It displays trends, profit and the demand of such video games over 3 decades.
Preprocessing: I have taken the "video_games.csv" dataset. The data has been preprocessed using Tableau Prep. All errors, null values and inconsistencies have been removed and adjusted to as to reduce the error margin.
Design: Using various tools and features provided by MS Excel, I have added action filters, charts and graphs to visualize the data. The right amount of charts and filtering enables and visually appealing display of the data in the dashboard.
Every project comes with its challenges. This dashboard was no different. It took some proper inspection and verification to find and deal with the problems.
This dashboard visually depicts the sales of videogames over the last 3 decades providing valuable insight on the trends and demands. It provides specific and targeted visualization of the given data which is crucial for a proper analysis. The combination of graphs, filters, pivot tables and charts make it visually appealing and easy to handle for new and experienced users.