Debkalpa Das👋
Innovative and enthusiastic CSE Professional. Proficient in data visualization,
manipulation
and analysis. Skilled in problem solving,
creative thinking, leadership and management.

Innovative and enthusiastic CSE Professional. Proficient in data visualization,
manipulation
and analysis. Skilled in problem solving,
creative thinking, leadership and management.
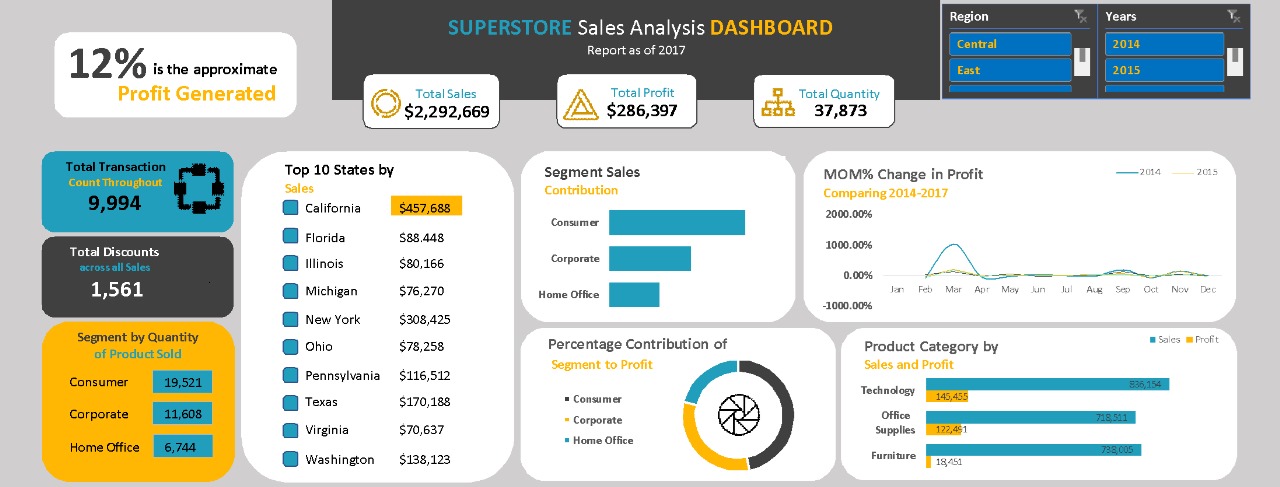
In this project, I have developed a Supermarket Sales Analysis Dashboard for the years 2014-2017. The dashboard provides an in-depth analysis of segment sales performance, total discounts, MOM change in profit, and total profit over these years. It aims to help stakeholders identify key sales patterns, profits earned, and top sales state-wise to make informed business decisions.
Preprocessing: For this project, I utilized the supermarket sales dataset spanning 2014 to 2017. The data preprocessing was carried out using tools such as Tableau Prep and Python for data cleaning and transformation. The dataset was meticulously cleaned to address missing values, outliers, and inconsistencies. This process included normalization of dates, correction of data entry errors, and consolidation of various data sources to ensure accuracy and completeness.
Design:The dashboard design features interactive elements like action filters and slicers to allow users to explore data by year and/or region. Key performance indicators (KPIs) such as total sales and average transaction value are prominently displayed. Various charts and graphs, including bar and line charts, visualize sales trends, comparisons, and distributions, providing a comprehensive and user-friendly analysis of the supermarket sales data from 2014 to 2017.
Every project comes with its challenges. This dashboard was no different. It took some proper inspection and verification to find and deal with the problems.
This dashboard effectively meets its goal of delivering comprehensive insights into supermarket sales from 2014 to 2017. It offers clear and targeted visualizations that highlight segment sales performance, total discounts, MOM change in profit, total profit and product performance. By integrating KPIs, interactive filters, and various charts, the dashboard provides both an engaging and user-friendly experience, making it accessible for users with varying levels of expertise. The result is a powerful tool for analyzing sales data and making informed business decisions.