Debkalpa Das👋
Innovative and enthusiastic CSE Professional. Proficient in data visualization, manipulation
and analysis. Skilled in problem solving,
creative thinking, leadership and management.

Innovative and enthusiastic CSE Professional. Proficient in data visualization, manipulation
and analysis. Skilled in problem solving,
creative thinking, leadership and management.
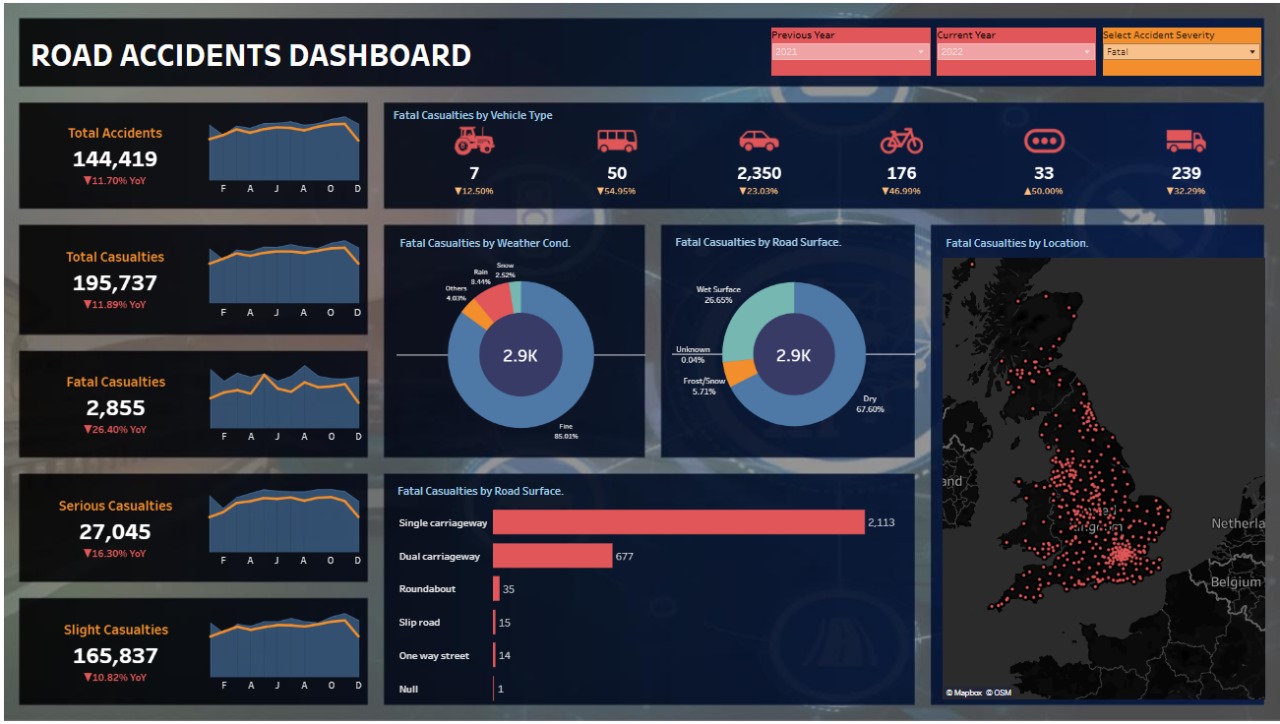
Tableau Data Analysis
In this project, I have created a dashboard which prominently shows the road accidents which have occurred over the last 5 years and the vehicles which contribute to most of them.
Preprocessing: I have taken the accident.csv dataset. The data has been preprocessed using Tableau Prep. All errors, null values and inconsistencies have been removed and adjusted to as to reduce the error margin.
Design:Using various tools at my disposal, I have added action filters, KPIs, charts and graphs to visualize the data. Tis makes the information easily filterable to cater to specific needs and also gives a visually stunning look to the dashboard.
Every project comes with its challenges. This dashboard was no different. It took some proper inspection and verification to find and deal with the problems. .
This dashboard successfully achieved its objectives of providing valuable insight on the road accidents filtered by time and mode of transport. It provides specific and targeted visualization for the given data which is crucial for a proper analysis. The combination of KPIs, filters and charts make it visually appealing and easy to handle for new and experienced users.